The U.S. Department of Labor found that costs of a bad hire can add up to 30 percentage of the hire’s annual salary, without considering the cost of damaged culture.
McKinsey found a 67% increase in productivity on the bottom line between top-performing and average performing employees.
According to work institute retention report, 43 of 100 new employees quit within the first 90 days, and 66 of 100 new employees quit within the first 180 days.
Personality testing such as talent assessments yields up to 41% increased ability to predict future performance for new employees.
1Nearly 74% of employers admit that they have made a wrong hire - And we have seen the costs above. Break the pattern and get recruitment right.
1Gain increased transparency into your candidates with FirstMinds informative analytics and actionable insights.
1New employees are 30% less efficient over 90 days before reaching average productivity if their onboarding is not well-planned and personalized.
1FirstMind customers have been able to decrease time to hire, which enables them to secure the best talent in the market before others do.
1By considering an applicants talents before the first interview, enables you only to spend time on the suitable candidates.
1

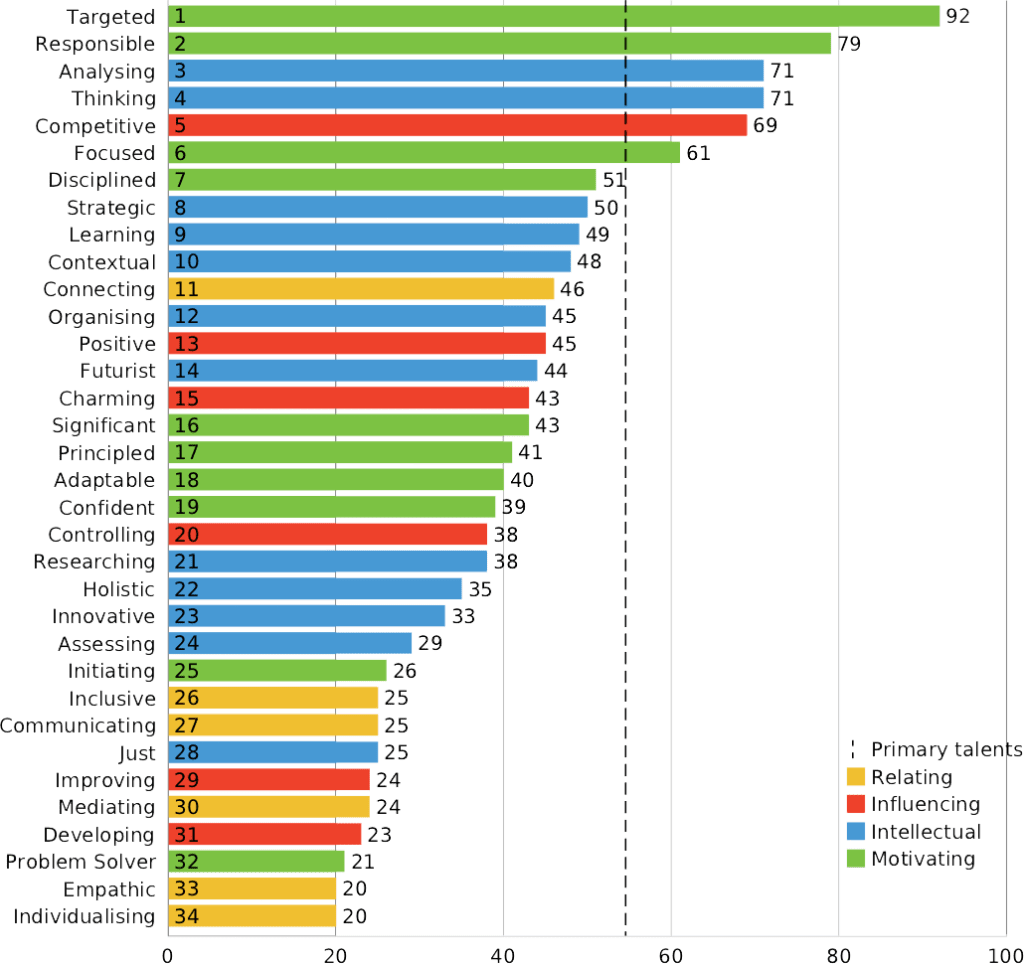
The science behind FirstMind builds on 43 cognitive studies, 9 behavioural studies, and 1.2 million people. These studies show that the way our nerve cells are connected in our brain affects our personality and behaviour. They also found that human personality can be categorised into 34 universal talents. Each person has a unique combination of talents that determines what behaviour is most natural to them, what they can become great at, and which tasks they receive energy from working on.
This graph ranks your talents and indicates your unique combination. A talent represents your consistent behaviour, feelings, and thoughts that lay the foundation for your personality and strengths. If you leverage your primary talents, you will be able to increase your performance by 200-300%, and you will get energised in your work. Conversely, when you can’t utilise your primary talents, you will be inefficient, get drained from energy and never become more than average at the task.
This graph ranks your talents and indicates your unique combination. A talent represents your consistent behaviour, feelings, and thoughts that lay the foundation for your personality and strengths. If you leverage your primary talents, you will be able to increase your performance by 200-300%, and you will get energised in your work. Conversely, when you can’t utilise your primary talents, you will be inefficient, get drained from energy and never become more than average at the task.
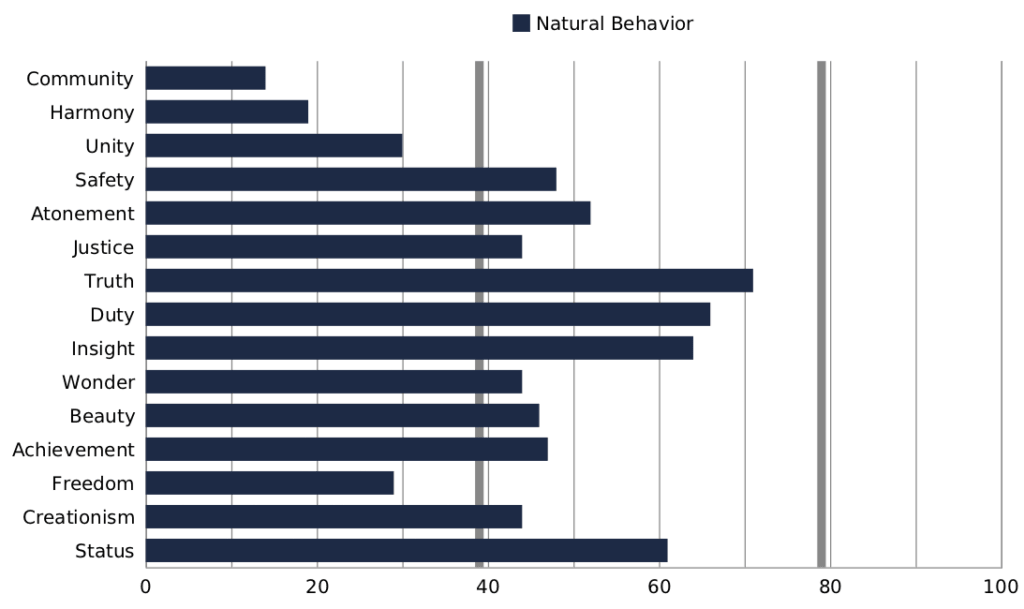
This graph illustrates 15 universal motivational drivers found by Diller et al. (2008). The drivers explain what we as human are motivated by. Gain an in-depth understanding of what the person is motivated by and use it as a leader or employer to engage the employee and build incentive plans.
This graph illustrates 15 universal motivational drivers found by Diller et al. (2008). The drivers explain what we as human are motivated by. Gain an in-depth understanding of what the person is motivated by and use it as a leader or employer to engage the employee and build incentive plans.
Gain insights into what behaviour motivates the individual. Unlike Motivational Drivers that analyses the fundamental factors of the person’s motivation, Motivational Behaviour is more task-specific and indicates which behaviours you get driven by doing in your work and everyday life.
Gain insights into what behaviour motivates the individual. Unlike Motivational Drivers that analyses the fundamental factors of the person’s motivation, Motivational Behaviour is more task-specific and indicates which behaviours you get driven by doing in your work and everyday life.
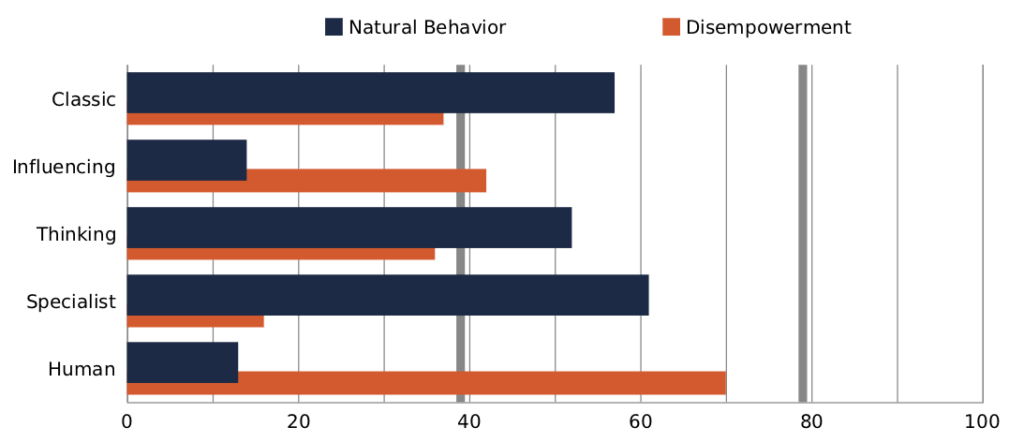
This graph gives an understanding of the individual’s typical behaviour in everyday work. It translates the 34 talents into more concrete task-specific insights that can be used to leverage personal strengths and to position the employee in a team or the company.
This graph gives an understanding of the individual’s typical behaviour in everyday work. It translates the 34 talents into more concrete task-specific insights that can be used to leverage personal strengths and to position the employee in a team or the company.

Gain actionable insights into what makes high performing teams and how the individual contributes best in this team. Professor Belbin identified nine team roles that must be present in all high performing teams. This graph indicates which of these roles the individual is able to excel in.
Gain actionable insights into what makes high performing teams and how the individual contributes best in this team. Professor Belbin identified nine team roles that must be present in all high performing teams. This graph indicates which of these roles the individual is able to excel in.

This graph serves two purposes. Firstly, it brings insights into which type of behaviour and stress signals the individual shows if they get stressed, which can be used as preventive measures to counter stress. Secondly, it gives you an understanding of how prone the person is towards stress.
This graph serves two purposes. Firstly, it brings insights into which type of behaviour and stress signals the individual shows if they get stressed, which can be used as preventive measures to counter stress. Secondly, it gives you an understanding of how prone the person is towards stress.

Learn how the individual contributes to knowledge creation and wherein the process, the person creates the most value. For companies to successfully innovate, problem-solve and crystallise it’s learnings to pass through the organisation, it needs to ensure that it has contributors at each step of the process. Use this graph to understand wherein the process of knowledge creation your company is strong and bring the right people on board to support the remaining stages.
Learn how the individual contributes to knowledge creation and wherein the process, the person creates the most value. For companies to successfully innovate, problem-solve and crystallise it’s learnings to pass through the organisation, it needs to ensure that it has contributors at each step of the process. Use this graph to understand wherein the process of knowledge creation your company is strong and bring the right people on board to support the remaining stages.
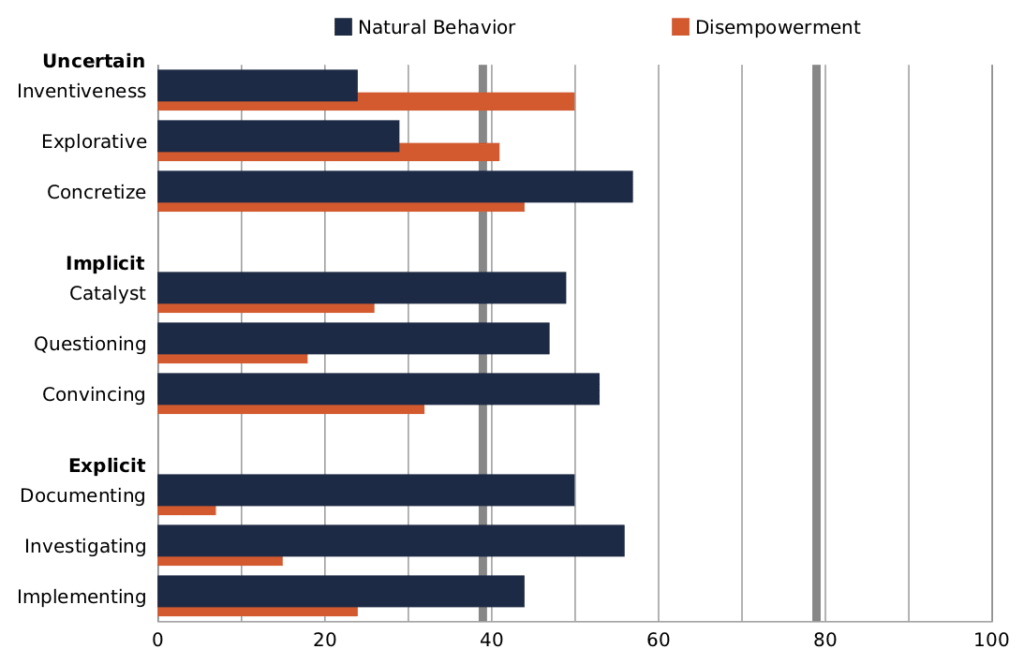
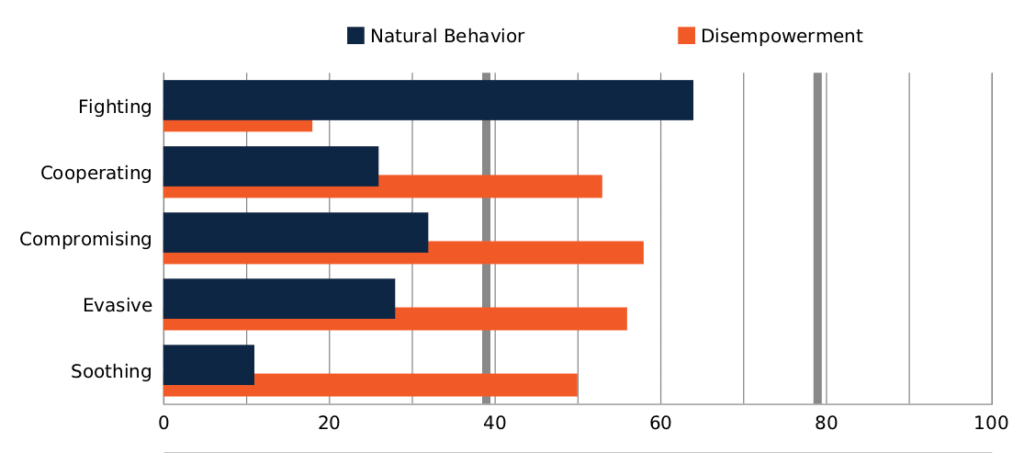
Understand the most natural behaviour of the person in a context where two or more people exchange views, opinions, or knowledge. The graph indicates which of the five typical discussion behaviours is most natural for the individuals and in which contexts the person will deviate from their usual behaviour.
Understand the most natural behaviour of the person in a context where two or more people exchange views, opinions, or knowledge. The graph indicates which of the five typical discussion behaviours is most natural for the individuals and in which contexts the person will deviate from their usual behaviour.
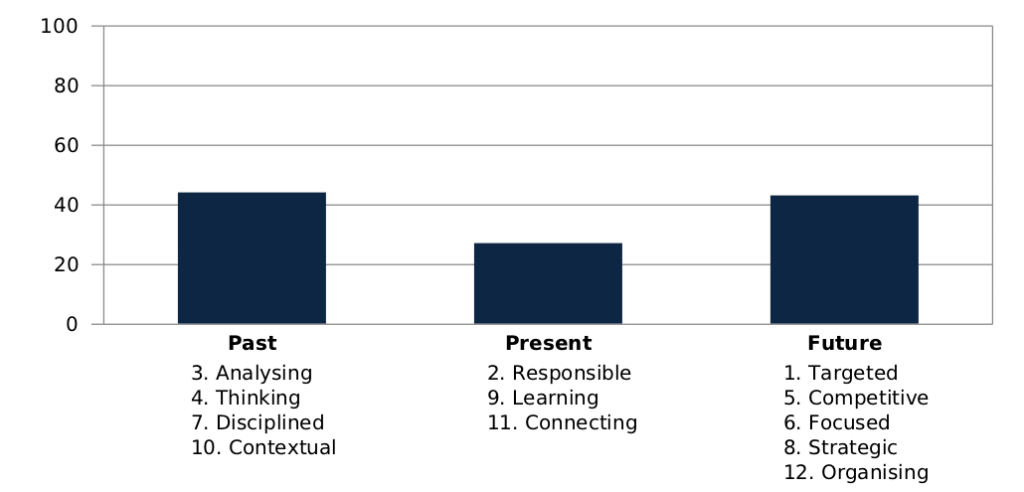
Gain insights into what time dimension the person tends to focus and how this focus applies. This graph gives an indication of the perception of people, where they tend to look for answers, and much more. It is important to consider the time focus as you position people in your company to enable them to create maximum value.
Gain insights into what time dimension the person tends to focus and how this focus applies. This graph gives an indication of the perception of people, where they tend to look for answers, and much more. It is important to consider the time focus as you position people in your company to enable them to create maximum value.

We offer a variety of consulting services that significantly increases your probability of hiring the right person for your position while you still spend your time on what you do best.